Random Forest 실습
라이브러리 import 및 설정
%reload_ext autoreload
%autoreload 2
%matplotlib inline
from matplotlib import pyplot as plt
from matplotlib import rcParams
import numpy as np
from pathlib import Path
import pandas as pd
from sklearn.ensemble import RandomForestClassifier
from sklearn.metrics import accuracy_score
from sklearn.model_selection import train_test_split
import seaborn as sns
import warnings
rcParams['figure.figsize'] = (16, 8)
plt.style.use('fivethirtyeight')
pd.set_option('max_columns', 100)
pd.set_option("display.precision", 4)
warnings.simplefilter('ignore')
학습데이터 로드
03-pandas-eda.ipynb에서 생성한 feature.csv 피처파일 사용
data_dir = Path('../data/dacon-dku')
feature_dir = Path('../build/feature')
sub_dir = Path('../build/sub')

trn_file = data_dir / 'train.csv'
tst_file = data_dir / 'test.csv'
sample_file = data_dir / 'sample_submission.csv'

target_col = 'class'
seed = 42
algo_name = 'rf'
feature_name = 'feature'
model_name = f'{algo_name}_{feature_name}'

feature_file = feature_dir / f'{feature_name}.csv'
sub_file = sub_dir / f'{model_name}.csv'
df = pd.read_csv(feature_file, index_col=0)
print(df.shape)
df.head()
(400000, 20)
| z | redshift | dered_u | dered_g | dered_r | dered_i | dered_z | nObserve | airmass_u | class | d_dered_u | d_dered_g | d_dered_r | d_dered_i | d_dered_z | d_dered_ig | d_dered_zg | d_dered_rz | d_dered_iz | d_obs_det | |
|---|---|---|---|---|---|---|---|---|---|---|---|---|---|---|---|---|---|---|---|---|
| id | ||||||||||||||||||||
| 0 | 16.9396 | -8.1086e-05 | 23.1243 | 20.2578 | 18.9551 | 17.6321 | 16.9089 | 2.9444 | 1.1898 | 0.0 | -0.1397 | -0.0790 | -0.0544 | -0.0403 | -0.0307 | -2.6257 | -3.3488 | 2.0462 | 0.7232 | -15.0556 |
| 1 | 13.1689 | 4.5061e-03 | 14.9664 | 14.0045 | 13.4114 | 13.2363 | 13.1347 | 0.6931 | 1.2533 | 1.0 | -0.0857 | -0.0574 | -0.0410 | -0.0322 | -0.0343 | -0.7683 | -0.8698 | 0.2767 | 0.1016 | -0.3069 |
| 2 | 15.3500 | 4.7198e-04 | 16.6076 | 15.6866 | 15.4400 | 15.3217 | 15.2961 | 1.0986 | 1.0225 | 0.0 | -0.1787 | -0.1388 | -0.0963 | -0.0718 | -0.0540 | -0.3649 | -0.3905 | 0.1440 | 0.0257 | -0.9014 |
| 3 | 19.6346 | 5.8143e-06 | 25.3536 | 20.9947 | 20.0873 | 19.7947 | 19.5552 | 1.6094 | 1.2054 | 0.0 | -0.3070 | -0.1941 | -0.1339 | -0.1003 | -0.0795 | -1.2000 | -1.4395 | 0.5321 | 0.2395 | -1.3906 |
| 4 | 17.9826 | -3.3247e-05 | 23.7714 | 20.4338 | 18.8630 | 18.1903 | 17.8759 | 2.6391 | 1.1939 | 0.0 | -0.6820 | -0.2653 | -0.1794 | -0.1339 | -0.1067 | -2.2436 | -2.5579 | 0.9871 | 0.3144 | -9.3609 |
y = df[target_col].values[:320000]
df.drop(target_col, axis=1, inplace=True)
trn = df.iloc[:320000]
tst = df.iloc[320000:]
feature_name = df.columns.tolist()
print(y.shape, trn.shape, tst.shape)
(320000,) (320000, 19) (80000, 19)
학습/검증 데이터 구분
X_trn, X_val, y_trn, y_val = train_test_split(trn, y, test_size=.2, random_state=seed)
print(X_trn.shape, X_val.shape, y_trn.shape, y_val.shape)
(256000, 19) (64000, 19) (256000,) (64000,)
Random Forest 모델 학습
clf = RandomForestClassifier(n_estimators=100,
                             min_samples_leaf=10,
                             max_features='auto',
                             max_samples=.5,
                             random_state=seed,
                             n_jobs=-1)
clf.fit(X_trn, y_trn)
p_val = clf.predict(X_val)
p_tst = clf.predict(tst)
print(f'{accuracy_score(y_val, p_val) * 100:.4f}%')
92.4531%
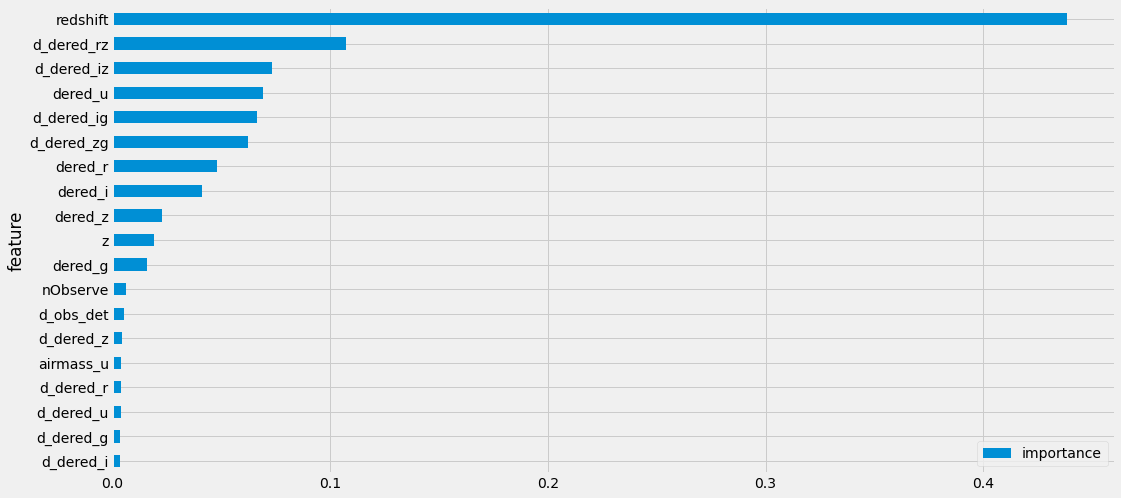
피처 중요도 시각화
imp = pd.DataFrame({'feature': trn.columns, 'importance': clf.feature_importances_})
imp = imp.sort_values('importance').set_index('feature')
imp.plot(kind='barh')
<matplotlib.axes._subplots.AxesSubplot at 0x7fa7eabb6810>
제출 파일 생성
sub = pd.read_csv(sample_file, index_col=0)
print(sub.shape)
sub.head()
(80000, 1)
| class | |
|---|---|
| id | |
| 320000 | 0 |
| 320001 | 0 |
| 320002 | 0 |
| 320003 | 0 |
| 320004 | 0 |
sub[target_col] = p_tst
sub.head()
| class | |
|---|---|
| id | |
| 320000 | 2.0 |
| 320001 | 0.0 |
| 320002 | 2.0 |
| 320003 | 0.0 |
| 320004 | 2.0 |
sub[target_col].value_counts()
2.0    42317
0.0    29937
1.0     7746
Name: class, dtype: int64
sub.to_csv(sub_file)